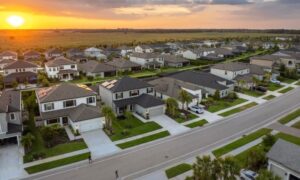
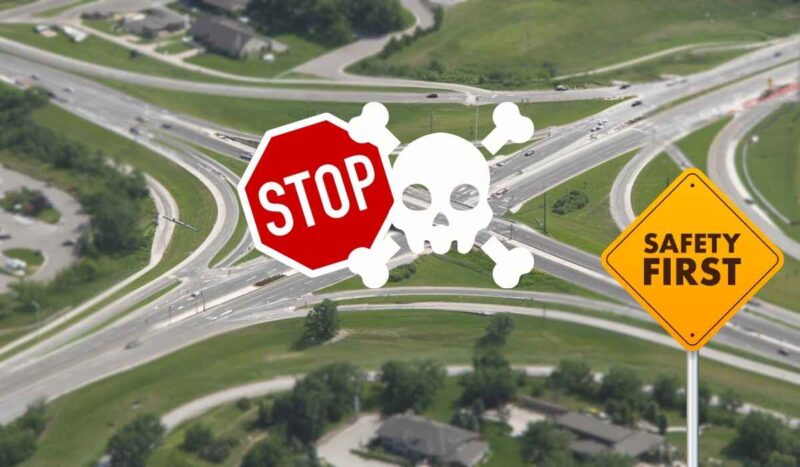
Iowa continues to face serious traffic safety challenges at busy intersections across the state. High traffic volume, outdated designs, and risky driver behavior contribute to a higher crash risk in specific locations.
Driver awareness plays a major role in reducing injuries, fatalities, and costly property damage.
Intersection rankings referenced here rely on Iowa DOT crash data and legal safety analysis focused on measurable risk factors.
| Intersection | Total Crashes | Vehicles Involved | Fatalities | Peak Risk Times |
|---|---|---|---|---|
| U.S. 6 / W. Kimberly Rd. / Marquette St. Davenport | 45 | 96 | 2 | Noon to 6 p.m. |
| U.S. 61 / Harrison St. / W. Locust St. Davenport | 63 | 129 | / | 7 a.m. to 11 a.m. and afternoon to early evening |
| IA-27 / Iowa 58 / Viking Rd. Cedar Falls | 66 | 142 | 2 | 10 to 11 a.m. and 5 to 6 p.m. |
| U.S. 69 / SE 14th St. / E. Indianola Ave. Des Moines | 74 | / | / | 5 p.m. to 8 p.m. |
| I-235 / School St. / MLK Jr. Pkwy Des Moines | 60 | / | / | 8 a.m. to 8 p.m. |
U.S. 6 / W. Kimberly Rd. / Marquette St. Davenport
Heavy commercial traffic and constant cross movement place sustained pressure on this Davenport intersection. Midday congestion combines with shopping, service vehicles, and commuter traffic, increasing reaction demands on drivers.
Recorded crash data shows a pattern tied to congestion and delayed braking during peak daytime hours.
- 45 total crashes involving 96 vehicles
- 2 fatalities and multiple injury cases
- Property damage exceeding $260,000
Risk rises significantly between noon and 6 p.m., when traffic volume increases, and driver frustration becomes more common. Sudden stops and aggressive lane changes often precede rear-end and angle crashes.
U.S. 61 / Harrison St. / W. Locust St. Davenport
Commuter flow and arterial traffic combine at this intersection, creating frequent conflict points during morning and afternoon travel windows. Commercial access points and signal timing challenges add to collision exposure.
Crash records point to consistent patterns connected to driver behavior and time of day.
- 63 total crashes involving 129 vehicles
- 30 crashes resulting in injuries
- Property damage totaling more than $255,000
Highest crash frequency occurs between 7 a.m. and 11 a.m., with another spike during the afternoon and early evening periods. Tailgating and red-light violations repeatedly appear as leading causes, especially during heavier traffic cycles.
IA-27 / Iowa 58 / Viking Rd. Cedar Falls
Multiple highway connections converge at this Cedar Falls intersection, creating a demanding environment for turning and through traffic.
High vehicle counts and frequent directional changes increase decision pressure for drivers.
- 66 crashes involving 142 vehicles
- 2 fatalities
- Property damage exceeding $450,000
Peak risk periods center on 10 to 11 a.m. and 5 to 6 p.m. Failure to yield during left turns remains the primary issue. Documented crash types show:
- 30 angle collisions linked to turning conflicts
- 20 rear-end crashes tied to sudden stops
U.S. 69 / SE 14th St. / E. Indianola Ave. Des Moines
Urban traffic density and mixed vehicle use define this Des Moines intersection.
Commuter traffic, local access, and signal spacing contribute to frequent stopping and acceleration cycles.
- 74 total crashes
- Dozens of injury reports
- No fatalities recorded
Highest danger occurs between 5 p.m. and 8 p.m. Rear-end collisions dominate reported incidents, often connected to signal violations and short following distances. Crash history also includes:
- 2 motorcycle-related incidents
- 1 semi-truck crash
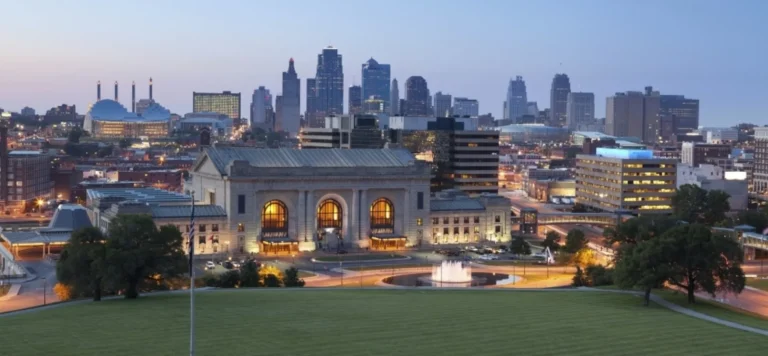
I-235 / School St. / MLK Jr. Pkwy Des Moines
Complex traffic movement and heavy daily volume place constant strain on driver decision-making at this intersection. Long operating hours and varied vehicle types increase exposure throughout the day.
- 60 total crashes
- Numerous injury and property damage cases
- No fatalities listed
Nearly two-thirds of crashes result from signal violations. High crash frequency extends between 8 a.m. and 8 p.m., reflecting all-day congestion. Recorded incidents also involve:
- 2 bus-related crashes
- 1 semi-truck collision
Focused Look at Des Moines Metro Dangerous Intersections
Urban traffic conditions in the Des Moines metro area create added pressure on several key intersections.
High commuter volumes, freight movement, pedestrian activity, and complex signal systems combine to increase crash exposure throughout the day.
Intersections listed below show consistent risk patterns tied to congestion, visibility limits, and driver decision-making during peak travel periods.
SE 14th Street and Maury Street
Freight movement and daily commuter traffic converge along this Des Moines corridor, creating sustained congestion throughout much of the day.
Long traffic queues limit safe following distances and increase pressure on drivers to react quickly in stop-and-go conditions.
Evening rush periods present the greatest risk, as traffic density rises and braking patterns become less predictable. Rear-end collisions appear frequently due to short spacing and delayed reaction times.
- Heavy truck presence mixed with passenger vehicles
- Repeated stop cycles during peak congestion
- Limited buffer space between vehicles
Crash severity increases when drivers attempt to maintain speed in dense traffic rather than allowing additional stopping distance.
I-235 and School Street / MLK Jr. Parkway
Complex signal timing and visibility challenges affect safety performance at this high-volume interchange. Cloudy conditions and reduced contrast between signals and surroundings make it harder for drivers to anticipate light changes while approaching at higher speeds.
Incident patterns point to ongoing signal-related risks, particularly when traffic remains heavy throughout the day.
- Frequent traffic light violations
- Reduced visibility during overcast conditions
- Large vehicle involvement such as buses and trucks
Vehicle size differences amplify impact forces during collisions, raising the likelihood of injuries and extensive property damage.
University Avenue and 6th Avenue
Downtown traffic flow, pedestrian crossings, and frequent turning movements combine to create a demanding environment at this intersection.
High vehicle turnover and limited maneuvering space require constant attention and precise timing.
Risk increases during busy periods as drivers manage multiple decision points at once.
- Turning vehicles crossing pedestrian paths
- Lane changes within short distances
- High foot traffic during business and event hours
Collision reports often link incidents to turning conflicts and missed pedestrian cues, especially when traffic volume peaks.
How “Dangerous Intersections” Are Defined
@jonjon.jpeg It would be easy for a city to pull data and identify the most dangerous parts of a neighborhood. That information could go straight to city counselors or Public Works so they can work systematically to make those intersections safer. It does not always have to be expensive. It does not always have to be drastic. I could probably make a short video series on this area alone, but I want to focus on what might be the most dangerous intersection in my neighborhood, where more than seven crashes have happened in the last calendar year. #Urbanism #StreetSafety #CityPlanning #SafeStreets #TacticalUrbanism ♬ original sound – jonjon.jpeg
Dangerous intersections in Iowa are identified through the Iowa DOT Safety Improvement Candidate Locations list.
Evaluation focuses on measurable crash patterns and severity indicators.
Criteria include total crash counts and seriousness of outcomes, number of vehicles involved per incident, time patterns connected to driver behavior such as tailgating or signal violations, and documented injuries, fatalities, and estimated property damage costs.
Locations with repeated high-risk indicators receive closer attention for safety planning.
Common Contributing Factors
Iowa DOT identifies dangerous intersections through the Safety Improvement Candidate Locations list. Evaluation centers on consistent, data-driven indicators tied to crash frequency and severity.
- Total crash counts and injury or fatal outcomes
- Number of vehicles involved per incident
- Time patterns linked to driver behavior like tailgating or signal violations
- Estimated property damage costs
Locations showing repeated high-risk patterns receive closer review for safety improvements and enforcement strategies.
Safety Tips for Drivers
High-volume intersections demand steady attention and disciplined driving habits.
Crash data shows that many serious collisions occur when drivers underestimate congestion or attempt to move too quickly through controlled intersections.
Allowing more space and anticipating traffic flow changes improves reaction time and lowers the chance of sudden-impact crashes.
Spacing between vehicles plays a critical role during stop-and-go traffic. Longer following distances reduce the likelihood of rear-end collisions and help prevent multi-vehicle chain reactions.
Signal compliance also remains essential, as red-light and late-yellow violations often lead to severe angle crashes.
- Maintaining extra following distance during congestion and peak travel hours
- Staying alert for turning vehicles, merging traffic, and sudden lane changes
- Planning trips outside peak congestion windows when schedules allow
- Reducing speed and increasing focus during low-visibility conditions such as cloud cover or poor lighting
Patience and controlled driving decisions significantly reduce risk exposure.
Consistent caution at known high-risk intersections helps protect drivers, passengers, and pedestrians across Iowa roadways.
Summary
Knowledge of high-risk intersections supports safer travel decisions across Iowa.
Careful driving habits combined with situational awareness reduce the likelihood of crashes.
Continued infrastructure improvements and community safety efforts also play a key role in lowering long-term intersection risk.